Planning and RL in Markov Decision Processes
Solving MDPs using Planning and RL methods
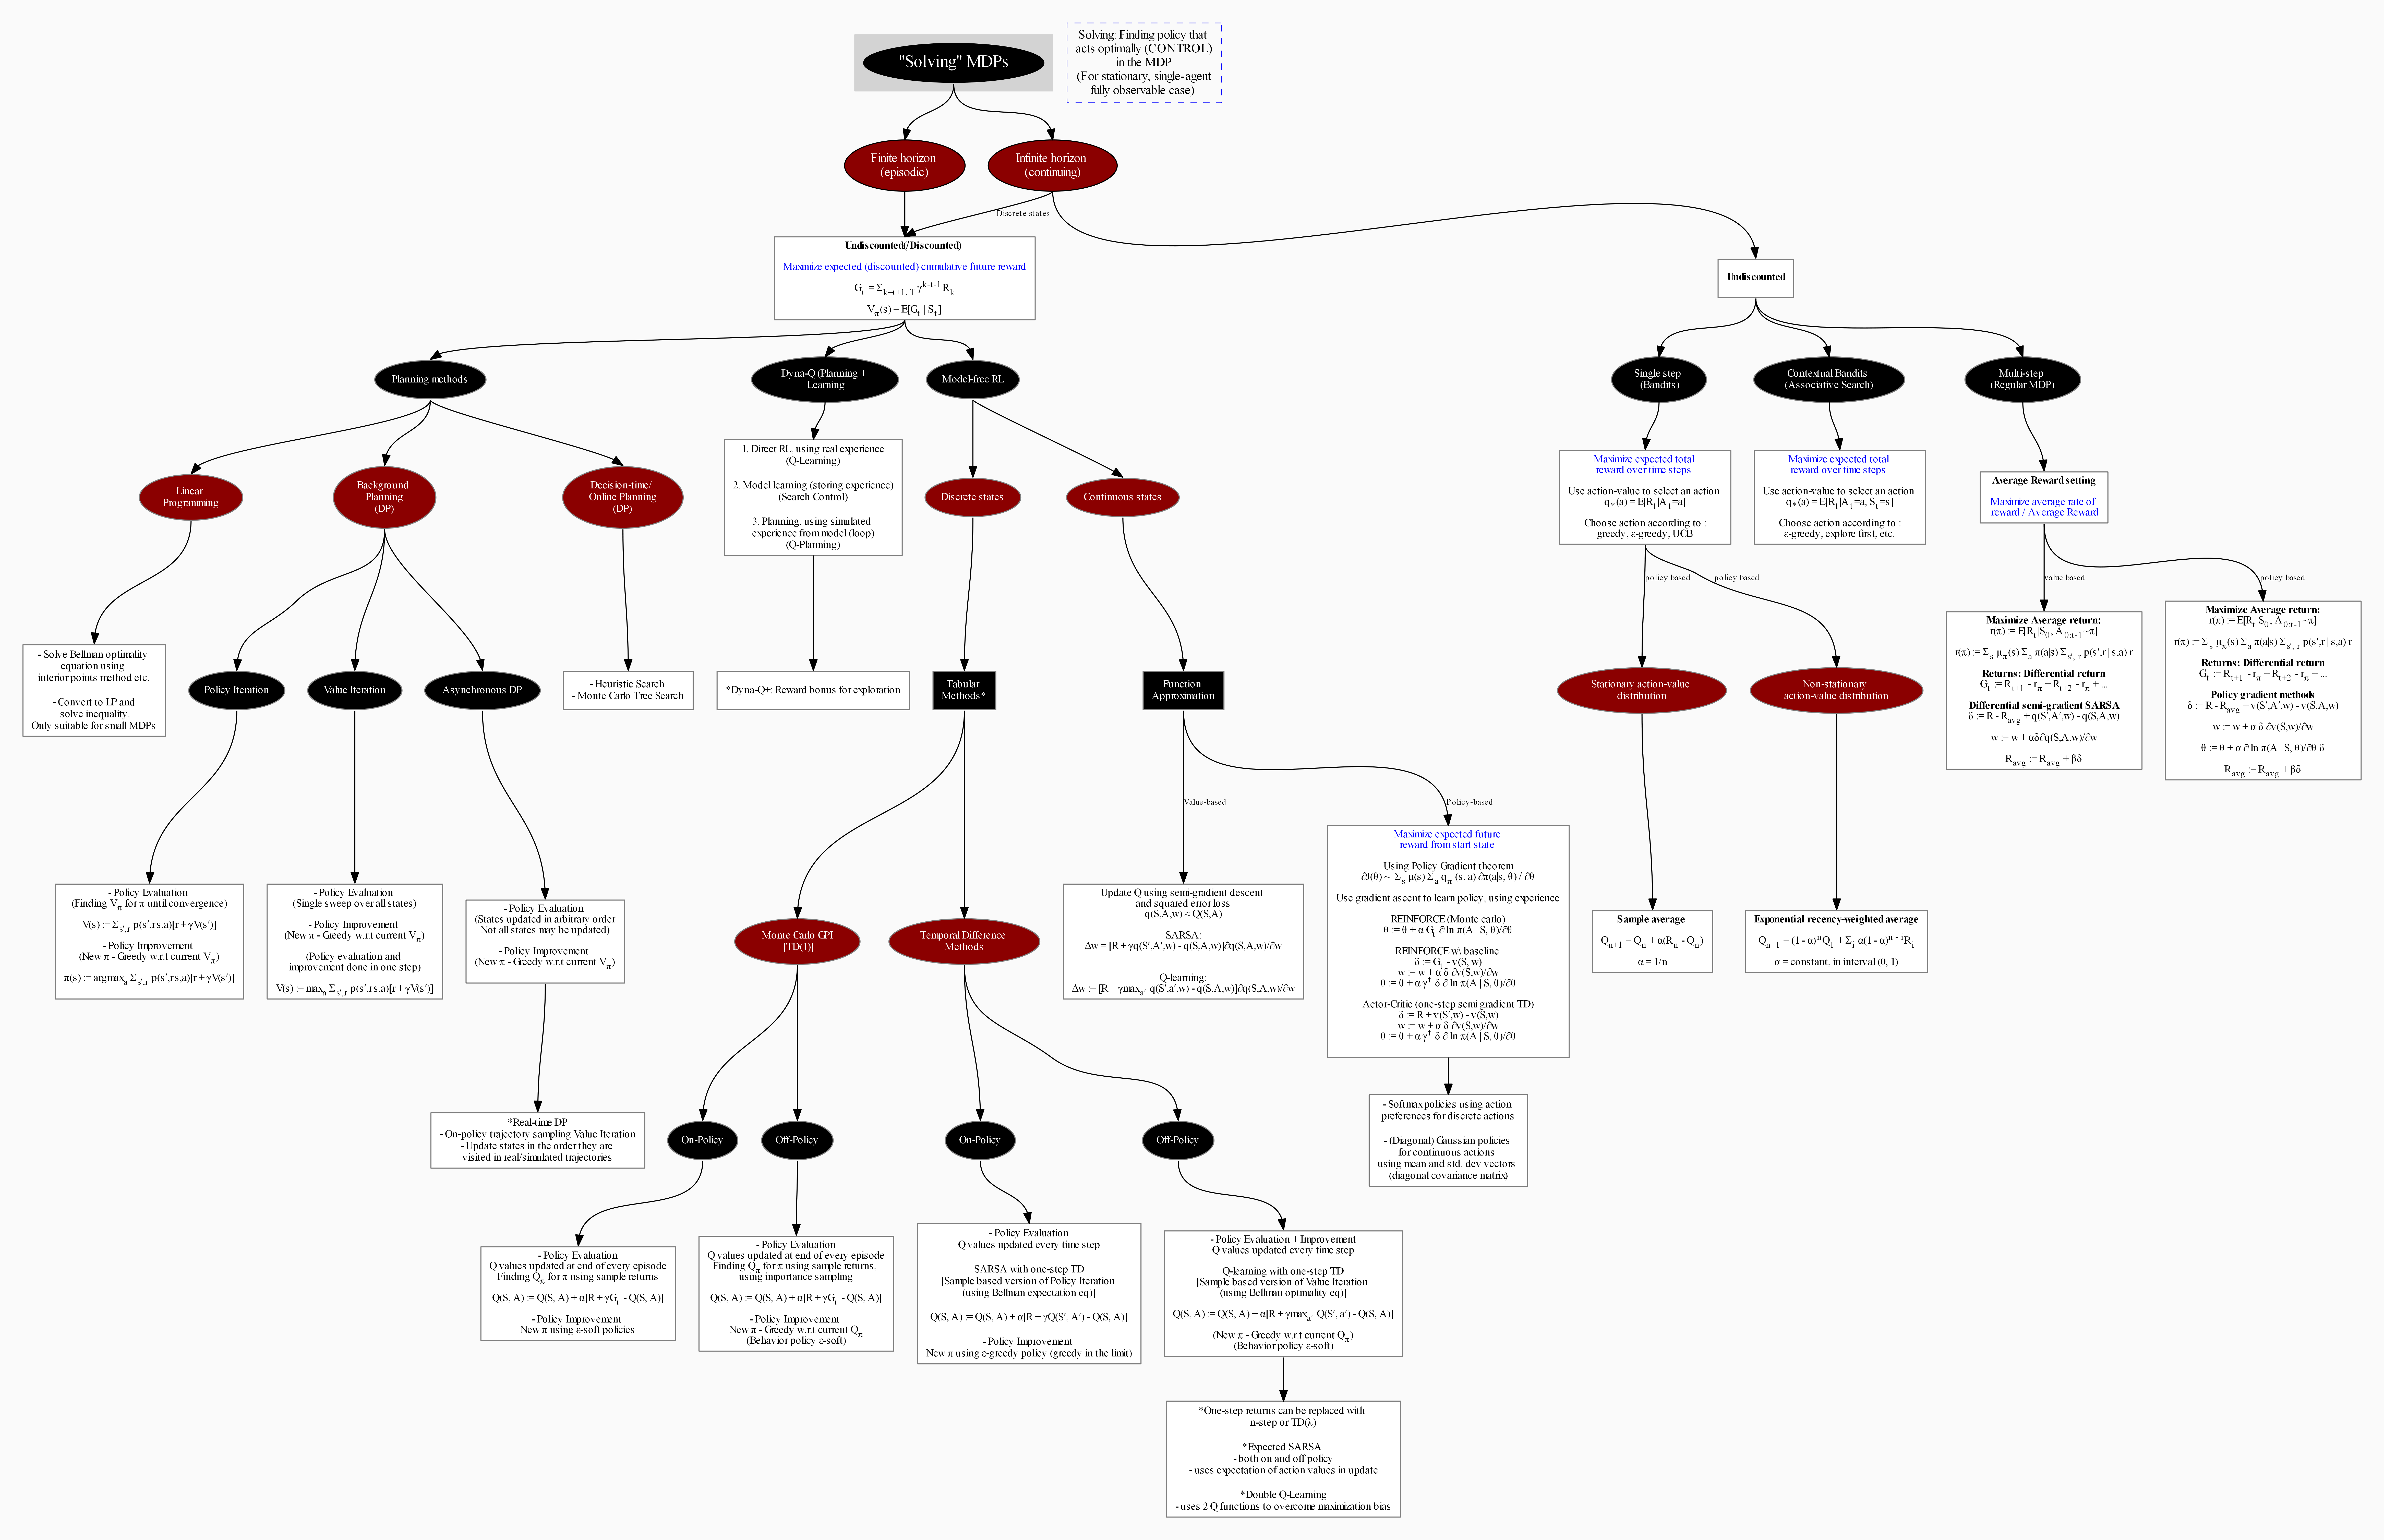
A visualization of a survey of methods (planning and reinforcement learning) used to solve (sequential) decision problems constructed via Markov Decision Processes, meant mostly as a cheatsheet, to support the Sutton & Barto textbook. I started to work on it, as a way of keeping up with all the loaded terms, and especially to differentiate between the various problem settings of episodic, continuous horizon, continuous states/actions etc.
I may add to this as I continue surveying the field, but will probably create new versions for specific other cases (since this one blew up).
A word on notation. I abuse notation slightly in the visualization, to make it more consistent, and to deal with dot’s symbol limitations. This notation is mostly consistent with the Sutton & Barto textbook.

The full version is available here
Notation:
: Full (Monte carlo) return
: Discount factor
S, S’, A, R : Specific states, action and reward, in sample based methods
s, s’, a, r : States, action and reward variables
E : Expectation
: State-value function under policy
: Action-value function under policy
v(S, w) : Approx to state-value function, for state S, and weights vector w
q(S, A, w) : Approx to action-value function, for S, A and weights vector w
: Derivaties instead of the more concise
(dot->png conversion did not like
)
: Probability of being in state s, according to stationary distribution
: Learning rates
: Average return following policy
References:
[1] Reinforcement Learning, An Introduction. R, Sutton and A. Barto. Second Edition, http://www.incompleteideas.net/book/the-book.html
[2] RL Specialization, Coursera, M. White and A. White, https://www.coursera.org/specializations/reinforcement-learning
[3] OpenAI Spinning Up, https://spinningup.openai.com/en/latest/index.html
Acknowledgements:
- Graphviz Library https://graphviz.org/doc/info/lang.html
- Graphviz Templates by C, Eyssette https://github.com/eyssette/graphviz-templates
- Graphviz web visualization http://viz-js.com/ and http://webgraphviz.com/